

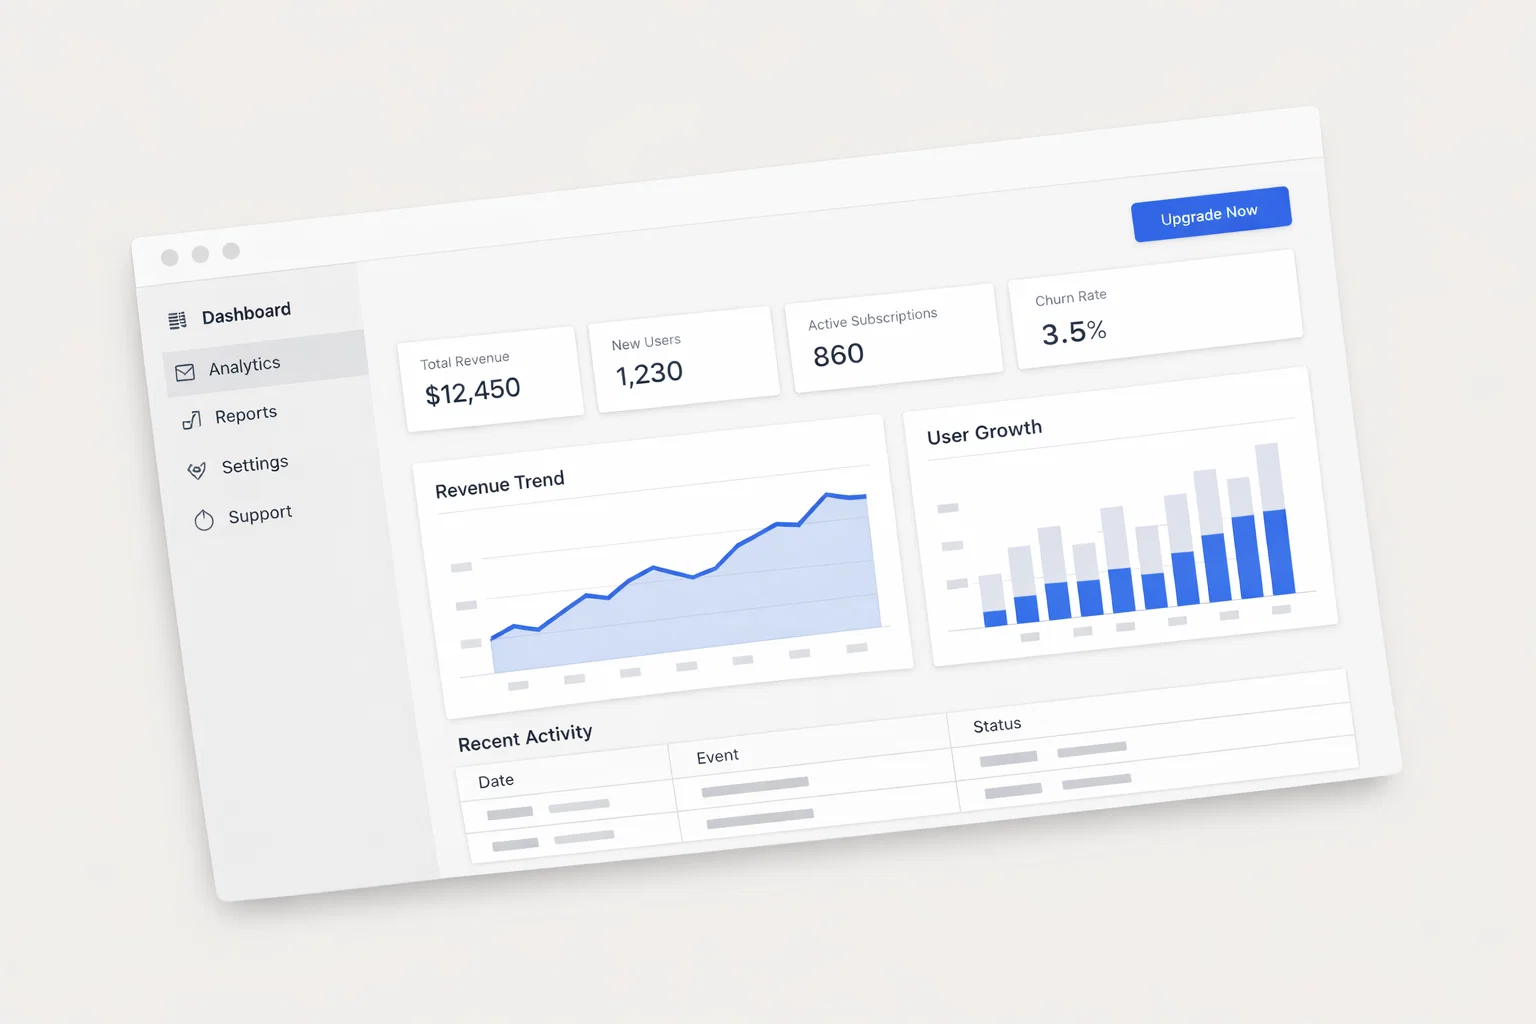
The investment application market represents one of the most structurally compelling growth opportunities in modern fintech. The global stock trading and investing applications market was valued at $63.6 billion in 2025, projected to reach $76.6 billion in 2026 at a 20.4% CAGR, and expected to surpass $150 billion by 2030. This is not merely a technology story — it reflects a fundamental democratization of capital markets access.
Key investment takeaways:
- Retail investors now represent 20–35% of daily trading volume in the US, UK, and South Korea, and 40–50% in India and China
- Approximately 60% of retail investors use mobile trading apps as their primary investment platform
- The addressable market extends beyond equities to multi-asset trading, robo-advisory, and social investing features
- Regulatory evolution (commission-free mandates, investor protection frameworks) is structurally favorable
| Metric | Assessment | Comment |
| Market Size (2025) | $63.6B | Strong established base |
| Growth Rate (CAGR) | 18.5–20.4% | Top quartile fintech growth |
| Risk Level | Medium–High | Regulatory and competitive concentration risk |
| Time Horizon | 3–7 years | Capture platform maturity cycle |
| Target Investor Profile | Growth-oriented, tech-sector allocators | Suitable for aggressive and balanced mandates |
Understanding the Nature of Investment Applications
Investment applications function as financial infrastructure intermediaries — they monetize transaction flow, assets under management (AUM) fees, premium subscriptions, and data licensing. Unlike pure software businesses, they carry embedded financial risk through payment-for-order-flow (PFOF) models, regulatory exposure, and market-cycle dependency.
Returns in this space are generated through a combination of user acquisition economics, monetization depth per user, and platform stickiness. Platforms that successfully cross-sell from basic brokerage into wealth management, lending, or crypto custody achieve significantly higher lifetime value per customer.
Structural characteristics of the investment app category:
- Network effects from social/community trading features increase retention
- Marginal cost of serving additional users approaches near-zero at scale
- Revenue is highly correlated with market volatility (higher activity = higher revenue)
- Competitive moats are built through UX quality, regulatory licensing, and data assets
| Characteristic | Investment Apps | Traditional Brokerages |
| Commission Model | Zero/freemium | Transaction-based |
| User Acquisition Cost | High (competitive) | Moderate |
| Scalability | Very high | Moderate |
| Regulatory Complexity | Medium–High | Very High |
| Revenue Cyclicality | High | High |
Macroeconomic Drivers Affecting Investment Applications
The investment app sector operates at the intersection of technology adoption curves and financial market cycles. As interest rate normalization progresses through 2025–2026, the cost of capital for growth-stage fintech firms has normalized, creating a more disciplined competitive landscape that favors established platforms.
The structural tailwind from rising retail participation is the dominant macro driver. During the first half of 2025, retail investors injected $1.3 billion per day into markets — a 32.6% increase year-over-year — directly benefiting platforms that serve this cohort. Inflation normalization and improving real wage growth in developed markets have freed additional discretionary capital for investment.
| Macro Factor | Impact Direction | Sensitivity Level |
| Interest Rate Normalization | Positive (valuation support) | Medium |
| Inflation Moderation | Positive (more investable income) | Medium–High |
| Equity Market Volatility | Positive (higher trading activity) | Very High |
| GDP Growth | Positive (wealth effect) | Medium |
| Regulatory Tightening | Negative (compliance costs) | High |
| Emerging Market Smartphone Penetration | Strongly Positive | High |
Higher volatility environments typically increase daily active users and transaction volume- Commission-free models shift revenue sensitivity toward AUM and subscription income
- PFOF regulatory restrictions in the EU and potential US changes represent a structural headwind for certain platforms
Market Structure of the Investment Application Industry
The market is characterized by high concentration at the top tier with Robinhood, Schwab Mobile, Fidelity, E*TRADE, and international players like Moomoo, Trading 212, and eToro dominating retail mindshare. However, fragmentation persists in specialized verticals — options-focused apps, ESG platforms, fractional share services, and AI-driven advisory tools.
Entry barriers have risen materially since 2021–2022. Regulatory licensing costs, anti-money laundering (AML) infrastructure, and customer acquisition costs have significantly compressed the viable addressable market for new entrants.
Key market participants:
- Retail-focused brokerages: Robinhood, Webull, Moomoo (high volume, low ARPU)
- Full-service incumbents: Fidelity, Schwab, E*TRADE (high AUM, higher ARPU)
- Robo-advisors: Betterment, Wealthfront (~33% of retail investors now use robo-advisory)
- Portfolio aggregators: Personal Capital, Quicken
- International challengers: Trading 212, Freetrade, Stake (Australia/UK)
Investment Vehicles for Gaining Exposure
Investors seeking exposure to the investment application theme can access it through several instruments, ranging from direct public equity to thematic ETFs.
| Vehicle | Liquidity | Cost | Risk Level | Suitable For |
| Direct equity (e.g., HOOD, SCHW) | High | Low (commission-free) | High | Active, concentrated investors |
| Fintech sector ETFs (e.g., FINX, ARKF) | High | 0.50–0.75% expense ratio | Medium–High | Diversified thematic exposure |
| Broad financial services ETFs | High | 0.10–0.20% | Medium | Conservative growth allocators |
| Private equity / VC (pre-IPO apps) | Very Low | High (2/20 structure) | Very High | Institutional/accredited investors |
| Options on fintech equities | High | Variable (spread + premium) | Very High | Sophisticated hedgers/speculators |
Identify publicly listed pure-plays (Robinhood Markets: HOOD is the most liquid benchmark)- Screen fintech ETFs for investment-app weighting concentration
- Evaluate private market access through secondary platforms like Forge Global or EquityZen
- Consider blended exposure combining public equity + ETF for risk management
Fundamental Analysis Framework
Valuing investment application businesses requires platform economics metrics rather than traditional P/E analysis. The key driver of intrinsic value is the unit economics of user acquisition, monetization, and retention — expressed through metrics like ARPU (average revenue per user), LTV/CAC ratio, and AUM growth rate.
Core valuation metrics:
| Metric | Definition | Benchmark (Quality Platform) |
| ARPU | Revenue ÷ Monthly Active Users | $50–$150/year (retail), $500+ (wealth mgmt) |
| LTV/CAC Ratio | Customer lifetime value ÷ acquisition cost | >3x (sustainable), >5x (excellent) |
| Net Revenue Retention | Revenue retained + expanded from existing users | >110% (strong) |
| AUM Growth Rate | Year-over-year growth in assets on platform | >20% for growth-stage |
| Take Rate | Revenue as % of total transaction value | 0.05–0.30% depending on model |
Watch for revenue quality degradation: over-reliance on PFOF creates regulatory tail risk- Subscription revenue (premium tiers) commands higher valuation multiples than transaction-based revenue
- Platforms converting free users to paying subscribers at >5% conversion rates demonstrate strong product-market fit
Technical and Quantitative Evaluation
From a quantitative perspective, listed investment app stocks exhibit high beta characteristics (typically 1.4–2.0x market beta), making them sensitive to broader risk-on/risk-off cycles. Their revenue correlation to VIX levels is meaningfully positive — periods of elevated volatility drive user engagement spikes.
| Quantitative Indicator | Interpretation | Signal Threshold |
| Relative Strength (RSI) | Momentum | 40–60 neutral band for entry |
| Beta vs. S&P 500 | Systematic risk | 1.4–2.0 typical |
| Revenue-to-MAU Growth Correlation | Monetization efficiency | Positive divergence = bullish |
| Price/Sales Multiple | Valuation benchmark | 3–8x for profitable platforms |
| Short Interest | Sentiment | >15% = elevated speculative tension |
Execution sequence for position entry:
- Confirm macro environment is risk-on (yield curve stability, VIX below 20)
- Verify platform-specific revenue growth acceleration (>20% YoY)
- Enter on technical pullbacks toward 50-day or 200-day moving averages
- Size initial position at 50% target weight; scale on confirmation
- Set trailing stop-loss at 15–20% below cost basis
Risk Assessment
Investment application businesses carry a concentrated regulatory risk that distinguishes them from broader technology sector investments. The SEC, FINRA, FCA, and ASIC are each tightening disclosure, PFOF, and best execution requirements simultaneously.
| Risk Type | Probability | Impact | Mitigation Strategy |
| PFOF Regulatory Ban | Medium | High | Prefer platforms with diversified revenue |
| Market Downturn (lower MAUs) | Medium–High | High | Allocate through cycle, not tactically |
| Competitive Compression | High | Medium | Focus on platforms with network moats |
| Cybersecurity / Data Breach | Low–Medium | Very High | Assess SOC 2 compliance, insurance |
| Platform Disintermediation (AI agents) | Low (near-term) | High (long-term) | Monitor AI integration strategy |
| Liquidity Risk (small caps) | Medium | Medium | Concentrate in large-cap listed names |
Stress-test assumptions to validate:
- What happens to revenue if equity market volumes decline 30%?
- Can the platform sustain growth with CAC rising 20% in a competitive environment?
- How dependent is the model on a single regulatory jurisdiction?
Portfolio Allocation Strategy
Within a diversified portfolio, investment application exposure sits within the fintech/financial services technology sub-sector. It behaves as a growth-cyclical asset — positively correlated with equity markets but with amplified beta. It is not a defensive allocation.
| Allocation Scenario | Fintech App Weight | Portfolio Role | Rebalancing Trigger |
| Aggressive Growth | 5–8% | Core growth driver | ±2% band quarterly |
| Balanced Growth | 2–4% | Satellite position | ±1.5% band semi-annually |
| Capital Preservation | 0–1% | Tactical only | Discretionary |
| Thematic Tech Portfolio | 10–15% | Anchor position | ±3% band quarterly |
Allocation methodology steps:
- Establish total fintech sector budget (typically 5–15% of equity sleeve)
- Allocate 30–40% of fintech budget to investment app exposure specifically
- Blend direct equity with ETF wrapper to control idiosyncratic risk
- Rebalance when position drifts more than 2% from target weight
- Review fundamental thesis annually against MAU growth and regulatory developments
Taxation and Legal Considerations
In Australia (relevant to Sydney-based investors), investment app equities listed on the ASX or accessed via US markets through CHESS depository instruments are subject to standard capital gains tax treatment. Foreign-listed equities (e.g., HOOD on NASDAQ) held >12 months qualify for the 50% CGT discount for individuals.
- Dividends from US-listed fintech stocks are subject to 15% US withholding tax under the Australia–US tax treaty, with a foreign income tax offset available in Australia
- PFOF-generated income within investment apps is not directly taxable to investors but affects platform profitability reporting
- US estate tax can apply to Australian residents holding US-listed securities above USD $60,000 — structure via a company or trust wrapper for large positions
FATCA and FBAR reporting obligations apply if directly holding US